- Written by martial sankar
- Hits: 7642
Analytics & Acquisition Report #2

This blog report summarizes the web traffic on both the platform and the viewer for the period from 22th May to 22th December 2017.
Background : Semantics of analytics
If you are not familiar with web analytics, keep in mind this cheatsheet :-
General
- session = visit
- av. session duration = average duration of the session.
- bounce rate = percentage of user leaving the website without pursuing on other pages or making any interaction (e.g., scrolling or clicking).
- users = visitors.
- organic = visitors acquired from search engine results.
- direct = visitors landing to the website from various type of sources. It ranges from an embedded link in an email to typing an address on the browser.
- referral = visitors sent to the website from other website sources.
- social = visitors acquired from social media.
The HumaReC plateform, humarec.org
A steady, stabilized traffic
Following the momentous release of the HumaReC platform (up to 55 sessions at the launch, see AAR1 published in May 2017), the traffic is now stabilized to around 7 sessions per week. The peak at time 2017-08-09 is linked to Sara's HumaReC talk at the SNTS Annual Meeting in Pretoria (https://snts2017.org/).
Local institutions as primary users
The traffic is still led by local institutions in Switzerland and France. During the last months several connections (16) arise from US. This correlates with the trends we observed for the humarec-viewer as well.
Organic search-driven user acquisition

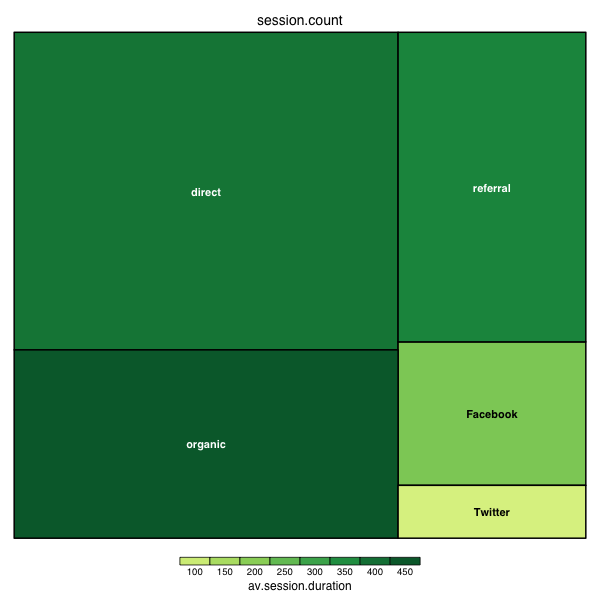
The above treemap view depicts the session duration as a function of the session frequency for each of the given source categories (i.e., direct, social, referral and organic). Though most of the traffic is still comparable to AAR1's acquisition treemap, the acquisition increase arising from organic search (one quarter of the total acquisitions in the last 7 months) as well as the duration of the corresponding sessions (around 440s or 7 min in average) is a nice surprise. In contrast, social media sessions (both for Facebook and Twitter) show a drop both in the number as well as the duration of the sessions since HumaReC's launching period. They were representing a quarter of the total number of sessions back in May 2017 whereas now, they hardly reach half a quarter.
The HumaReC's manuscript viewer
humarec-viewer.vital-it.ch379 sessions with an increasing trend over the months
The trend of the viewer is constantly increasing over the months with a peak of 39 sessions (2017-12-11) that occurred between two close folio releases (2017-12-08 and 2017-12-22).
HumaReC viewer and folio updates are followed worldwide
Although the bulk of sessions are coming from Switzerland, HumaReC piqued the interest of users in several other countries, notably Italy, France, US and Germany, which are closely following our folios releases :)
Summary And Perspectives
This second report summarizes our analytics of the HumaReC web traffic over the last seven months in both the plateform (humarec.org) and the viewer. Our platform attracts ca. 7 sessions/week (+/-4 users) with a total of 221 sessions for 182 users, a low bounce rate (7.9%) and ca. 6 min session duration/users. As compared to the last report, our session trends seem to stabilize over the months. These results are in contrast with the HumaReC manuscript viewer trends that show a traffic increase over the last months. In addition, session frequency peaks are generally correlated to releases of new folios. Last but not least, the platform seems well ranked on search engines since a total of 51 sessions arises from organic searches. Google Analytics is not providing natively the search terms but it could be interesting to know which search terms generate traffic income to the HumaReC platform.
Materials and Methods
Web analytics data collection
Web analytics data were collected using Google Analytics. The collected data were retreived from google using the Google Analytics Core Reporting API Version 3.0. This API permits to build complex queries through the provided dimensions and metrics explorer.
Data processing & visualization
After being retreived, the data were subsequently filtered for bots/spam and traffic that arises from local development. Despite enabling the default option for bot and spider filtering in google analytics, we spotted escaping bots/spam since their visits reports 100% bounce rate and 0 time session duration. However, this behavior can also correspond to a user leaving the page without interacting with it. We made the choice of removing such cases from our analytics, focusing on users that perform at least one interaction with the page (e.g., scrolling or clicking). Traffic data generated by local development were filtered based on internal IP and network domain values. The filtered data were then formated and exported in JSON format for interactive visualization. The line chart and barplot displayed above were obtained with the open-source chart.js library.
